In solutions there is not a single way to carry out a project, our CEO Jorge Niola with more than 10 years working on graphical interfaces for clients from several countries wrote this to share a little his experience in the development of projects of the EcoStruxure solution of Schneider Electric.
- Understand the client
- It’s not a traditional webpage
- Look for all available space
- Use Good quality images
- Think in layers
- Symmetry is important
- Time is money
Understand the client.

- Always have a meeting to understand the critical variables of the system. •Understand which things are “nice-to-have” & which one “must-have”.
- Maybe the final client doesn’t have a clear “must-have” variables, so we need to do a simulation of what they do day by day.
- Don’t assume all the clients need the same variables.
- Most of the times you’ll need to talk with operators, the ones that take measurements by hand and in paper.
- Knowing the variables, now we need to organize all in different types of graphics, our goal is to condensate in the less graphics possible.
It’s not a traditional webpage

- The first webpages were made years ago, and they exaggerate the use of links and sub-menus.
- In the Edge control software, we have the same possibilities of links to go from one diagram to another.
- Today, having less clicks is better, we are in the days of immediate info and we must design like this.
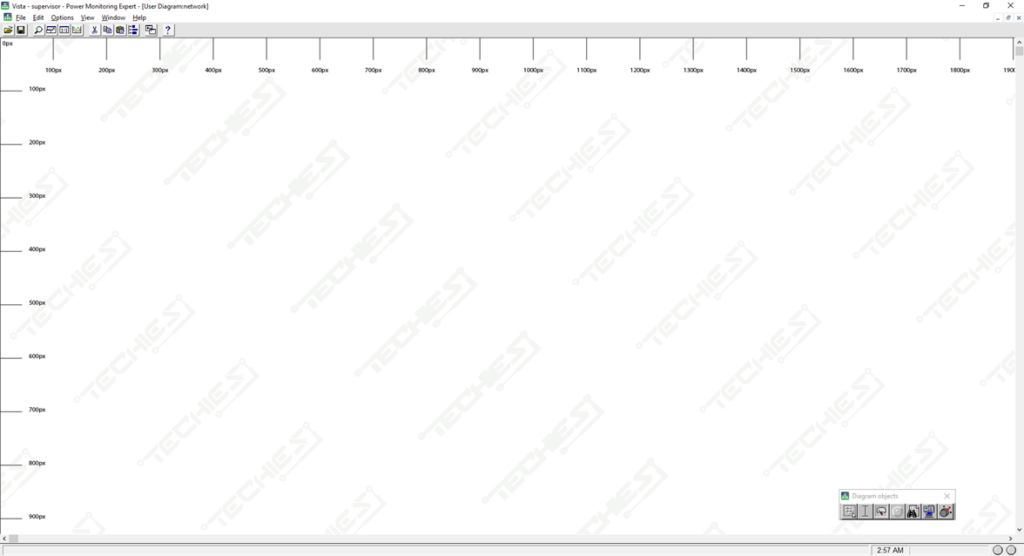
Look for all available space

- Carry out an analysis of the screen sizes where the system will be used, find the average dimension to avoid visualization problems.
- This task Will take a lot of time if you don’t have all the tools required.
- We have an image that you could use as a background and you can see and identify very fast the available space.
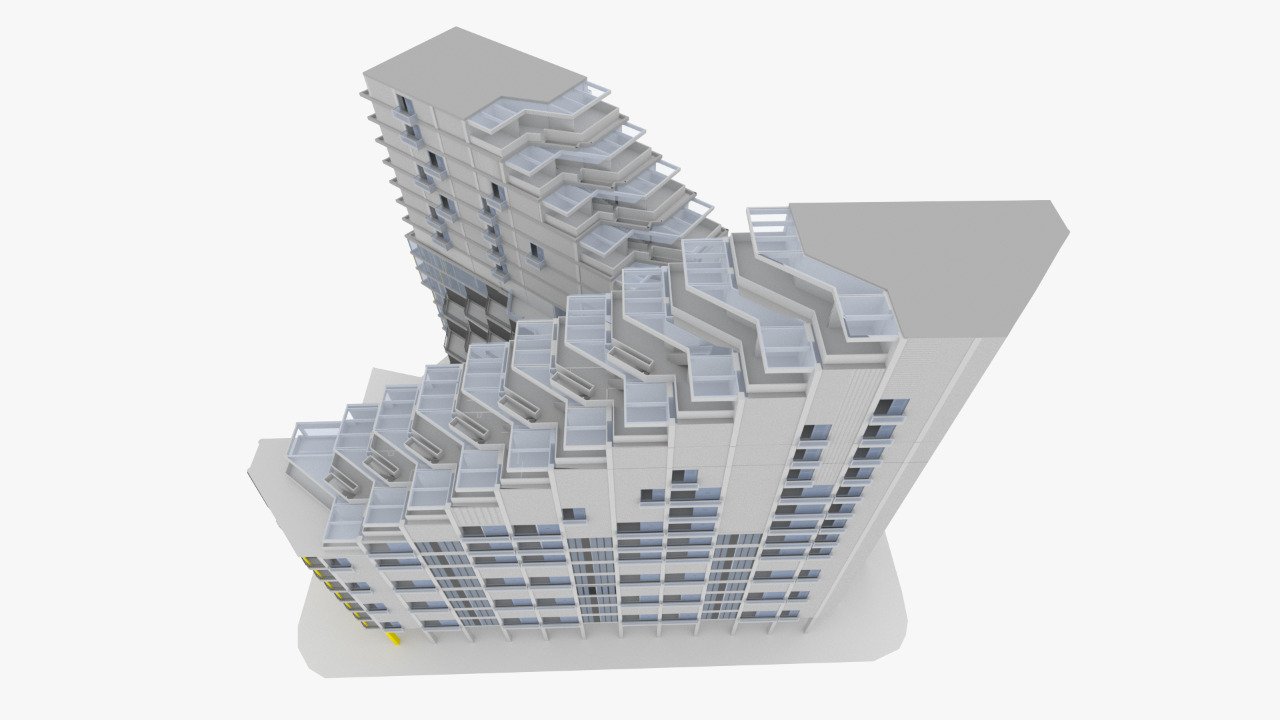
Use Good quality images
- Most of the time we focus in how to do an integration, learn a new protocol or make a complex Wireless communication and the graphical view is the least part we take care.
- A good presentation will lead the executed project to be a success story.

In the Right:
We have a free library with enhanced elements in different dimensions, download for free here
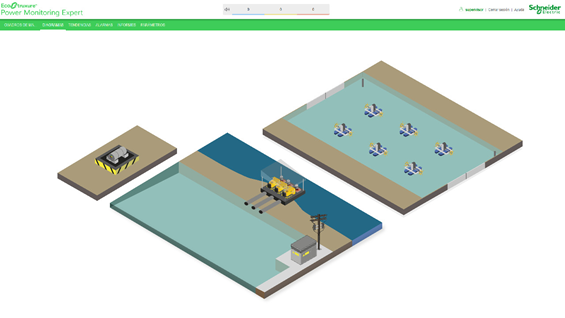
Think in layers
- There are tons of graphics but that doesn’t mean that they must be in the same layer.
- Place a good quality image, background 3D modeling then add the data layer.
- The data layer should have symmetry, it should have boxes of suitable colors so that the presentation is more pleasing to the eye.
- Remember that these screens are for monitoring and control, so it is fine to have a concentration of data but this must be done in an organized way.

Symmetry is important
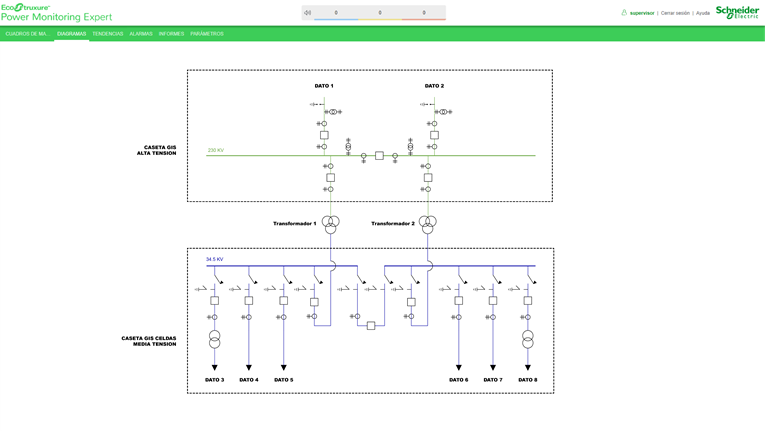
- If it is possible, look for a symmetry in the design.
- Find a way to distribute the names aligned vertical and horizontal.
- Symmetry will help to better understand the diagrams
Time is money
- Having an Engineer spending hours with complex graphics is not cost-efficient.
- One of the ways to improve the project’s margin is to implement it in the shortest possible time.
- The EcoStruxure specialist must be focus in the integration and communication, KPI’s.
- Trust the work of TechiesEC so that the graphic environment of your project is world class
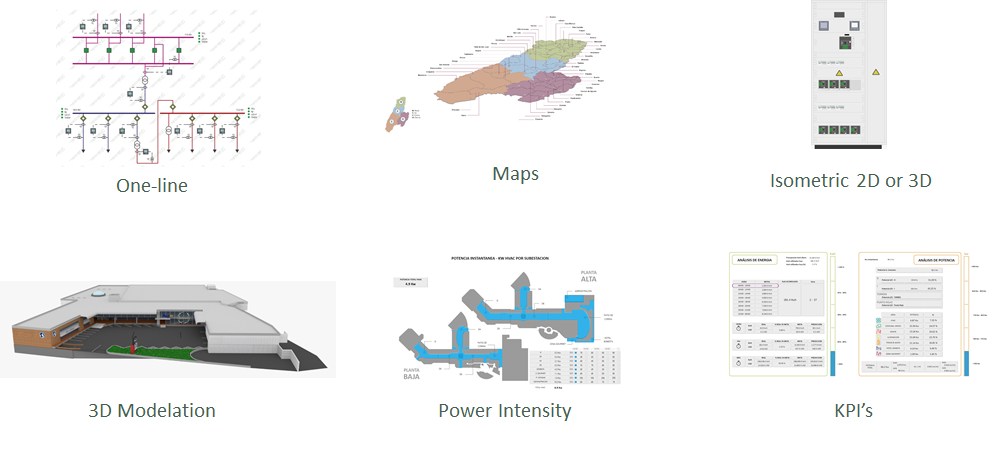
Types of graphics:
Benefits of Schneider Electric’s Edge control software.
- All the solutions has an advanced way to show graphics.
- Using flags will show status.
- Using scales will help to understand how critical is.
- By using the full potential of the programs, we should be able to understand the situation with a few clicks.
If you want to know more about our services feel free to write us, we will be more than happy to share our experience.
Contact us